How to Create an Animated Chart In Java Netbeans
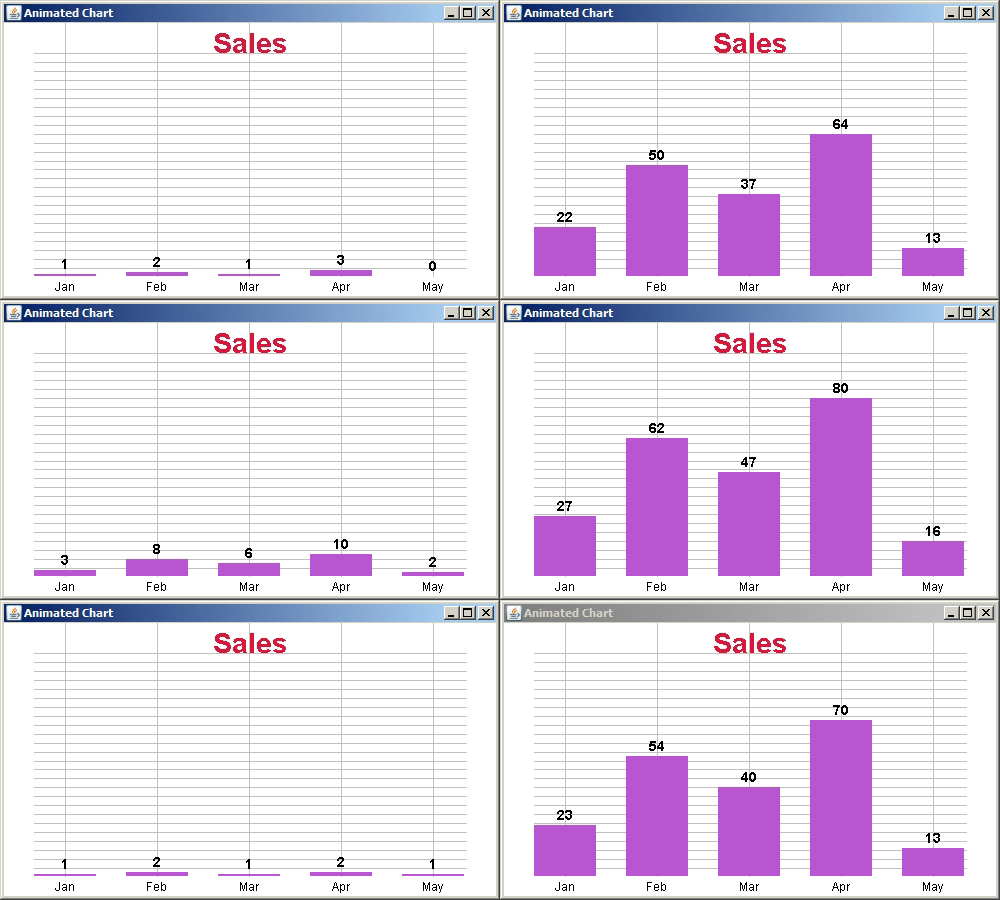
In this Java Tutorial we will see How To Create a Custom Animated chart displaying sales data for different months using graphics class in java netbeans.
This application display a bar chart representing sales data over several months, with the ability to transition between two sets of data.
What We Are Gonna Use In This Project:
- Java Programming Language.- NetBeans Editor.
Project Source Code:
package animatedchart;
import java.awt.Color;
import java.awt.Font;
import java.awt.FontMetrics;
import java.awt.Graphics;
import javax.swing.JFrame;
import javax.swing.JPanel;
import javax.swing.Timer;
/**
*
* @author 1BestCsharp
*/
public class AnimatedChart extends JPanel{
private String[] months = {"Jan","Feb","Mar","Apr","May"};
//private int[] data1 = {30,50,70,40,60};
//private int[] data1 = {100,100,100,100,100};
private int[] data1 = {00,00,00,00,00};
private int[] data2 = {27,63,47,81,16};
private int[] currentData = data1; // Initial data set
private int animationDuration = 2000; // Duration of the animation in milliseconds
private int animationSteps = 100; // Number of animation steps
private int[] animatedData = new int[data1.length];
private int step = 0;
private Timer timer;
private String chartTitle = "Sales";
public AnimatedChart(){
// Initialize the timer for the animation
timer = new Timer(animationDuration / animationSteps, (e) -> {
// Check if animation steps are completed
if(step <= animationSteps){
// Gradually adjust values between the starting and ending datasets for smooth transition.
for(int i = 0; i < data1.length; i++)
{
int startValue = data1[i];
int endValue = data2[i];
animatedData[i] = startValue + (endValue - startValue) * step / animationSteps;
}
step++;
repaint();
}
else{
// Animation is complete, switch to the new data set
currentData = (currentData == data1) ? data2 : data1;
step = 0;
timer.stop();
}
});
// Start the timer
timer.start();
}
@Override
protected void paintComponent(Graphics g){
super.paintComponent(g);
// Define chart dimensions and properties
int chartWidth = getWidth();
int chartHeight = getHeight();
int barSpacing = 30;
int barWidth = (chartWidth - (currentData.length+1) * barSpacing) / currentData.length;
// Set colors and fonts
g.setColor(new Color(63, 81, 181));
Font titleFont = new Font("Arial", Font.BOLD, 28);
Font labelFont = new Font("Arial", Font.PLAIN, 12);
Font valueFont = new Font("Arial", Font.BOLD, 14);
// Draw title
FontMetrics titleMetrics = g.getFontMetrics(titleFont);
int titleX = (chartWidth - titleMetrics.stringWidth(chartTitle))/2;
int titleY = 30;
g.setColor(new Color(220,20,60));
g.setFont(titleFont);
g.drawString(chartTitle, titleX, titleY);
// Draw horizontal lines
int numberOfLines = 25;
for(int i = 1; i <= numberOfLines; i++){
int y = chartHeight - i * (chartHeight - 50) / numberOfLines - 20;
g.setColor(Color.LIGHT_GRAY);
g.drawLine(barSpacing, y, chartWidth - barSpacing, y);
}
// Draw vertical lines
for(int i = 0; i <= currentData.length; i++){
int x = barSpacing + i * (barWidth + barSpacing) + barWidth / 2;
g.setColor(Color.LIGHT_GRAY);
g.drawLine(x, chartHeight - 20, x, 0);
}
// Draw the bars, labels, and values
for(int i = 0; i < currentData.length; i++){
int barHeight = (int)((double)animatedData[i] / 100 * (chartHeight - 50));
int x = barSpacing + i * (barWidth + barSpacing);
int y = chartHeight - barHeight - 20;
// Draw the bar
g.setColor(new Color(186,85,211));
g.fillRect(x, y, barWidth, barHeight);
// Draw the label (month)
String label = months[i];
int labelWidth = g.getFontMetrics(labelFont).stringWidth(label);
int labelX = x + (barWidth - labelWidth) / 2;
int labelY = chartHeight - 5;
g.setColor(Color.black);
g.setFont(labelFont);
g.drawString(label, labelX, labelY);
// Draw the value at the top of the bar
String value = Integer.toString(animatedData[i]);
int valueWidth = g.getFontMetrics(valueFont).stringWidth(value);
int valueX = x + (barWidth - valueWidth) / 2;
int valueY = y - 5;
g.setColor(Color.black);
g.setFont(valueFont);
g.drawString(value, valueX, valueY);
}
}
/**
* @param args the command line arguments
*/
public static void main(String[] args) {
JFrame frame = new JFrame();
frame.setTitle("Animated Chart");
frame.setSize(500, 300);
frame.setLocationRelativeTo(null);
frame.setDefaultCloseOperation(JFrame.EXIT_ON_CLOSE);
AnimatedChart chartPanel = new AnimatedChart();
chartPanel.setBackground(Color.white);
frame.add(chartPanel);
frame.setVisible(true);
}
}
The Final Result:
More Java Projects:
Download Projects Source Code


