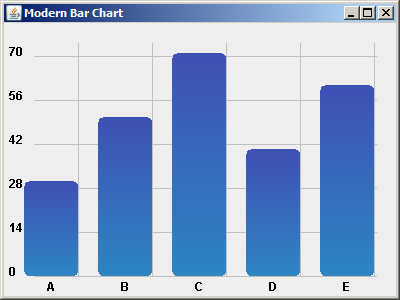
How to Create a Custom Bar Chart In Java Netbeans
In this Java Tutorial we will see How To Create a Custom Bar Chart from scratch with Gradient colors using graphics class in java netbeans.
What We Are Gonna Use In This Project:
- Java Programming Language.- NetBeans Editor.
Project Source Code:
package customchartbar;
import java.awt.Color;
import java.awt.Font;
import java.awt.GradientPaint;
import java.awt.Graphics;
import java.awt.Graphics2D;
import java.awt.geom.RoundRectangle2D;
import javax.swing.JFrame;
import javax.swing.JPanel;
/**
*
* @author 1BestCsharp
*/
public class BarChartPanel extends JPanel{
private boolean useOrangeGradiant = false;
@Override
protected void paintComponent(Graphics g)
{
super.paintComponent(g);
// Define your data and values for the chart
int[] values = {30,50,70,40,60,130,50,70,40,60};
String[] labels = {"A", "B", "C", "D", "E","A2", "B2", "C2", "D2", "E2"};
// Maximum value for scaling
int maxValue = 130;
// Set chart dimensions
int chartWidth = getWidth();
int chartHeight = getHeight();
// Define the spacing and size of bars
int barSpacing = 20;
int barWidth = (chartWidth - (values.length + 1)*barSpacing) / values.length;
// Set colors and fonts
g.setColor(new Color(63,81,181));
g.setFont(new Font("Arial",Font.BOLD, 12));
// Draw horizontal lines
int numHorizontalLines = 5;
int horizontalSpacing = (chartHeight - 50)/numHorizontalLines;
for(int i = 0; i <= numHorizontalLines; i++)
{
int y = chartHeight - 20 - i * horizontalSpacing;
g.setColor(Color.lightGray);
g.drawLine(30, y, chartWidth-20, y);
}
// Draw vertical lines
for(int i = 0; i < values.length; i++)
{
int x = 30 + i * (barWidth + barSpacing);
g.setColor(Color.lightGray);
g.drawLine(x + barWidth, 20, x+barWidth, chartHeight-20);
}
// Draw the bars and labels
for(int i = 0; i < values.length; i++)
{
int barheight = (int) ((double)values[i] / maxValue * (chartHeight - 50));
int x = 30 + i * (barWidth + barSpacing);
int y = chartHeight - barheight - 20;
GradientPaint gradient;
// Alternate between gradient colors
if(useOrangeGradiant)
{
gradient = new GradientPaint(x, y, new Color(255,140,0), x + barWidth, y + barheight, Color.YELLOW);
}
else
{
gradient = new GradientPaint(x, y, Color.blue, x + barWidth, y + barheight, Color.cyan);
}
// Toggle the flag
useOrangeGradiant = !useOrangeGradiant;
((Graphics2D) g).setPaint(gradient);
((Graphics2D) g).fill(new RoundRectangle2D.Double(x,y,barWidth, barheight,20,20));
// Draw the label
String label = labels[i];
int labelWidth = g.getFontMetrics().stringWidth(label);
int labelX = x + (barWidth - labelWidth) / 2;
int labelY = chartHeight - 5;
g.setColor(Color.black);// label color
g.drawString(label, labelX, labelY);
}
// Draw the vertical axis labels
int numTicks = 5; // Number of ticks on the vertical axis
int tickSpacing = (chartHeight - 50) / numTicks;
g.setColor(Color.black);// Axis label color
for(int i = 0; i <= numTicks; i++)
{
int tickValue = maxValue * i / numTicks;
String tickLabel = Integer.toString(tickValue);
int labelX = 5;
int labelY = chartHeight - 20 - i * tickSpacing;
g.drawString(tickLabel, labelX, labelY);
}
}
public static void main(String[] args) {
JFrame frame = new JFrame("Bar Chart");
frame.setDefaultCloseOperation(JFrame.EXIT_ON_CLOSE);
frame.setSize(600,400);
frame.setLocationRelativeTo(null);
BarChartPanel chartPanel = new BarChartPanel();
chartPanel.setBackground(Color.white);
frame.add(chartPanel);
frame.setVisible(true);
}
}
The Final Result:
More Java Projects:
Download Projects Source Code


