How to Create Dynamic Charts with PHP, Chart.js, and MySQL Database
The project consists of two main parts: a PHP script that establishes a database connection, fetches product data, and converts it to JSON, and an HTML/JavaScript page that retrieves and visualizes the data using the Chart.js library.
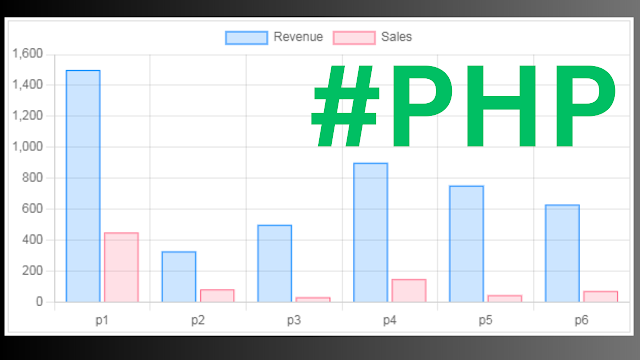
The resulting web page shows a bar chart illustrating product sales and revenue data.
Project Source Code:
- Create A Class "db_connect" To Connect Our Form With Database
This code establishes a PDO connection to a MySQL database with the given credentials (localhost, root, no password, and a database named products_manager) and configures the error mode to throw exceptions in case of any database operation errors.
<?php
$servername = "localhost";
$username = "root";
$password = "";
$dbname = "products_manager";
try
{
$conn = new PDO("mysql: host=$servername;dbname=$dbname", $username, $password);
$conn->setAttribute(PDO::ATTR_ERRMODE,PDO::ERRMODE_EXCEPTION);
}
catch(PDOException $ex)
{
echo"connection failed: " . $ex->getMessage();
die();
}
?>
- Create The Index Page To Display The Chart
The PHP code in the index page, connects to a database using 'db_connect.php', executes a query to retrieve all data from the 'products3' table, transforms the results into an associative array, and then converts the product data into JSON format.
In the HTML/JavaScript section, this code creates an HTML page with a canvas for a bar chart.
It retrieves product data in JSON format, initializes arrays for labels, revenue, and sales, and then uses Chart.js to generate a bar chart.
The product names are used as x-axis labels, and two datasets for revenue and sales data are presented in distinct colors. The chart's responsiveness and aspect ratio are configured as well.
<?php
// Include the database connection file
require_once 'db_connect.php';
// Fetch data from the database
$stmt = $conn->prepare("SELECT * FROM `products3`");
$stmt->execute();
$results = $stmt->fetchAll(PDO::FETCH_ASSOC);
$productData = [];
// Loop through the fetched results and store them in an array
foreach($results as $row){
$productData[] = $row;
//echo $row['name'];
}
// Convert the product data array to JSON format
$productJson = json_encode($productData);
?>
<!DOCTYPE html>
<html>
<head>
<title>Product Sales/Revenue Chart</title>
<script src="https://cdn.jsdelivr.net/npm/chart.js"></script>
</head>
<body>
<div style="width:600px; margin:50px auto; border:1px solid #ddd;">
<canvas id="productChart"></canvas>
</div>
<script>
// Retrieve the product data from PHP and assign it to a JavaScript variable
var productData = <?php echo $productJson; ?>;
// Initialize arrays to store labels, revenue data, and sales data
var labels = [];
var revenueData = [];
var salesData = [];
// Extract the necessary data from the productData array
for(var i=0; i<productData.length; i++)
{
var product = productData[i];
var revenue = product.revenue;
var sales = product.sales;
var productName = product.name;
// Add the product name to the labels array
labels.push(productName);
// Add the revenue and sales data to their respective arrays
revenueData.push(revenue);
salesData.push(sales);
}
// Create a bar chart using Chart.js
var ctx = document.getElementById('productChart').getContext('2d');
var chart = new Chart(ctx,{
type:'bar',
data:{
labels:labels,
datasets:[
{
label:'Revenue',
data:revenueData,
backgroundColor:'rgba(0,123,255,0.2)',
borderColor:'rgba(0,123,255,1)',
borderWidth:1
},
{
label:'Sales',
data:salesData,
backgroundColor:'rgba(255,99,132,0.2)',
borderColor:'rgba(255,99,132,1)',
borderWidth:1
}
]
},
options:
{
responsive:true,
maintainAspectRatio:true,
}
});
</script>
</body>
</html>
////// OUTPUT :


