Python Pie Chart Using Tkinter

How to Create a Pie Chart In Python Tkinter

How to Create a Pie Chart In Python Tkinter


In this Python tutorial we will create a pie chart using the Tkinter library for the graphical user interface. 
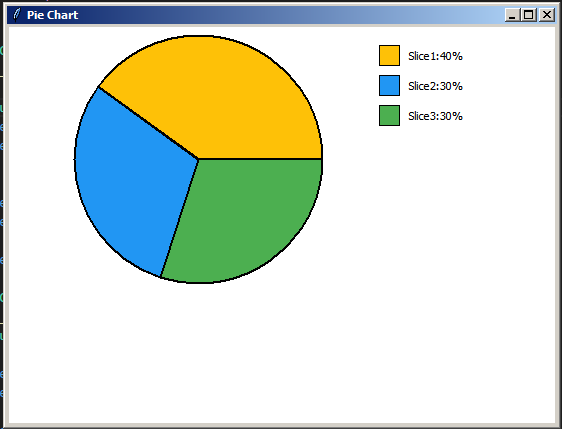
The pie chart displays three slices with predefined colors and values, along with a legend indicating the percentage of each slice.

What We Are Gonna Use In This Project:

- Python Programming Language.
- Tkinter for GUI.
- VS Code Editor.


Project Source Code:


import tkinter as tk
from tkinter import Canvas


class PieChart(tk.Tk):
def __init__(self):

super().__init__()
self.title("Pie Chart")
self.geometry("550x400")

# Create the PieChartPanel instance and pack it into the root window
self.pie_chart_panel = PieChartPanel(self)
self.pie_chart_panel.pack(fill=tk.BOTH, expand=True)

self.mainloop()

class PieChartPanel(Canvas):
def __init__(self, master = None):
super().__init__(master, bg="white")
# Define slice colors and data values for the pie chart
self.slice_colors = ["#FEC107", "#2196F3", "#4CAF50"]
self.data = [40, 30, 30]
# Draw the pie chart
self.draw_pie_chart()

def draw_pie_chart(self):
# Get the width and height of the canvas
width = self.winfo_reqwidth()
height = self.winfo_reqheight()
# Calculate the diameter of the pie chart
diameter = min(width, height) - 20
# Calculate the starting position of the pie chart
x = (width - diameter) / 2
y = (height - diameter) / 2
start_angle = 0

# Draw each slice of the pie chart
for i, value in enumerate(self.data):
# Calculate the angle of the current slice
arc_angle = int(value / 100 * 360)
# Draw the arc representing the slice
self.create_arc(x, y, x + diameter, y + diameter, start = start_angle,
            extent=arc_angle, fill=self.slice_colors[i], outline="black", width=2)
# Update the start angle for the next slice
start_angle += arc_angle
# Draw the legend for the pie chart
legend_x = width - 110
legend_y = 20

for i, value in enumerate(self.data):
# Draw colored rectangles representing each slice
self.create_rectangle(legend_x + 100, legend_y, legend_x + 120,
            legend_y + 20, fill=self.slice_colors[i])
# Add text indicating the percentage of each slice
self.create_text(legend_x + 130, legend_y + 10,
            text = f"Slice{i + 1}:{value}%", anchor=tk.W)
legend_y += 30


if __name__ == "__main__":
PieChart()


The Final Result:

Python Pie Chart Using Tkinter


Python Tkinter Animated Chart

How to Create An Animated Chart In Python Tkinter

How to Create An Animated Chart In Python Tkinter


In this Python tutorial we will create an animated bar chart using the Tkinter library for the graphical user interface. 
We will create an animated bar chart that transitions between two datasets over a specified duration.

What We Are Gonna Use In This Project:

- Python Programming Language.
- Tkinter for GUI.
- VS Code Editor.


Project Source Code:


import tkinter as tk
from tkinter import Canvas, StringVar
from time import sleep

class AnimatedChart(tk.Frame):
def __init__(self, master=None):
super().__init__(master)
self.master = master
self.pack()

self.months = ["Jan","Feb", "Mar", "Apr", "May"]
self.data1 = [00, 00, 00, 00, 00]
self.data2 = [27, 63, 47, 81, 16]
self.current_data = self.data1
self.animated_data = self.data1.copy()
self.animated_duration = 2000
self.animation_steps = 100
self.step = 0
self.chart_title = "Sales"

self.create_widgets()


def create_widgets(self):
# Create canvas
self.canvas = Canvas(self, width=600, height=450, bg="white")
self.canvas.pack()
# Start animation
self.timer_callback()
def timer_callback(self):
if self.step <= self.animation_steps:
for i in range(len(self.data1)):
# Update animated data based on current step
start_value = self.data1[i]
end_value = self.data2[i]
self.animated_data[i] = start_value + (end_value - start_value) *
                self.step / self.animation_steps

# Increment step and redraw chart
self.step += 1
self.draw_chart()
# Schedule next animation step
self.after(self.animated_duration // self.animation_steps,
            self.timer_callback)

else:
# Switch to the other set of data for the next animation cycle
self.current_data = self.data2 if self.current_data == self.data1
            else self.data1
self.step = 0


def draw_chart(self):
# Clear canvas
self.canvas.delete("all")

# Set chart dimensions
chart_width = 600
chart_height = 400
bar_spacing = 30
bar_width = (chart_width - (len(self.current_data) + 1) * bar_spacing) /
        len(self.current_data)

# Draw chart title
self.canvas.create_text(chart_width // 2, 30, text=self.chart_title,
        font=("Arial", 28, "bold"), fill="blue")

# Draw horizontal grid lines
for i in range(1, 26):
y = chart_height - i * (chart_height - 100) /25 - 20
self.canvas.create_line(bar_spacing, y, chart_width - bar_spacing, y,
            fill="#e0e0e0")


# Draw vertical grid lines
for i in range(len(self.current_data) + 1):
x = bar_spacing + i * (bar_width + bar_spacing) + bar_width / 2
self.canvas.create_line(x, chart_height - 20, x, 80, fill="#e0e0e0")


# Draw bars and labels
for i in range(len(self.current_data)):
bar_height = (self.animated_data[i] / 100) * (chart_height - 100)
x = bar_spacing + i * (bar_width + bar_spacing)
y = chart_height - bar_height - 20

# Draw bar
self.canvas.create_rectangle(x, y, x + bar_width, chart_height - 20,
            fill="#6a1b9a")

# Draw month label
self.canvas.create_text(x + bar_width / 2, chart_height - 5,
            text = self.months[i], font=("Arial", 12), fill="black")
# Draw bar value label
self.canvas.create_text(x + bar_width / 2, y - 10,
            text = str(int(self.animated_data[i])), font=("Arial", 14), fill="black")


if __name__ == "__main__":
root = tk.Tk()
root.title("Animated Chart")
app = AnimatedChart(master=root)
root.mainloop()


The Final Result:

Python Tkinter Animated Chart


Create an Image Slicer Using Python Tkinter

How to Split an Image Into Pieces Using Python Tkinter

How to Split an Image Into Pieces Using Python Tkinter


In this Python Tutorial, we will see how to create an Image Slicer application using python and tkinter.
When a user selects an image and specifies the number of slices, our Python script handles all the functionality including file reading, image processing, and dynamic grid generation.


Project Source Code:


import tkinter as tk
from tkinter import filedialog
from PIL import Image, ImageTk

class ImageSlicer(tk.Tk):
def __init__(self):
super().__init__()
# Set window properties
self.title("Image Slice")
self.geometry("900x500")
self.configure(bg="#fefefe")
# Create main container
self.main_container = tk.Frame(self, bg="#f7f7f7")
self.main_container.pack(fill=tk.BOTH, expand=True, padx=10, pady=10)

# Create top frame for controls
self.control_frame = tk.Frame(self.main_container, bg="#f7f7f7")
self.control_frame.pack(fill=tk.X, pady=(0, 10))

# Create and place the upload button
self.upload_btn = tk.Button(self.control_frame, text="Upload Image",
bg="#2196F3", fg="white",
font=("Arial", 12, "bold"), padx=20, pady=8, bd=0,
command=self.upload_image,
cursor="hand2", activebackground="#1976D2")
self.upload_btn.pack(side=tk.LEFT, padx=5)

# Create spinboxes for rows and columns
self.rows_var = tk.StringVar(value="5")
self.cols_var = tk.StringVar(value="5")

row_frame = tk.Frame(self.control_frame, bg="#f7f7f7")
row_frame.pack(side=tk.LEFT, padx=20)

tk.Label(row_frame, text="Rows", bg="#f7f7f7",
font=("Arial", 12)).pack(side=tk.LEFT)
tk.Spinbox(row_frame, from_=2, to=20, width=5, textvariable=self.rows_var,
font=("Arial", 12)).pack(side=tk.LEFT, padx=5)

col_frame = tk.Frame(self.control_frame, bg="#f7f7f7")
col_frame.pack(side=tk.LEFT)

tk.Label(col_frame, text="Columns", bg="#f7f7f7",
font=("Arial", 12)).pack(side=tk.LEFT)
tk.Spinbox(col_frame, from_=2, to=20, width=5, textvariable=self.cols_var,
font=("Arial", 12)).pack(side=tk.LEFT, padx=5)

# Create frame for slices
self.slices_frame = tk.Frame(self.main_container, bg="#f7f7f7")
self.slices_frame.pack(fill=tk.BOTH, expand=True)

# Store the current image
self.current_image = None


def calculate_image_size(self):
"""Calculate the maximum size for the image to fit in the window"""
# Get window dimensions with padding
padding = 40 # Total padding (20px on each side)
max_width = self.winfo_width() - padding
max_height = self.winfo_height() - self.control_frame.winfo_height() - padding

if self.current_image:
# Get original image dimensions
img_width, img_height = self.current_image.size
# Calculate scaling factor to fit window
width_ratio = max_width / img_width
height_ratio = max_height / img_height
scale_factor = min(width_ratio, height_ratio)

# Calculate new dimensions
new_width = int(img_width * scale_factor)
new_height = int(img_height * scale_factor)

return new_width, new_height
return None

def upload_image(self):
"""Handle image upload and processing"""
file_path = filedialog.askopenfilename(filetypes=[
("Images Files", "*.jpg *.jpeg *.png")])

if file_path:
# Open and store the image
self.current_image = Image.open(file_path)
self.refresh_slices()

def refresh_slices(self):
"""Refresh the image slices with current settings"""
if not self.current_image:
return
# Clear previous slices
for widget in self.slices_frame.winfo_children():
widget.destroy()

# Get number of rows and columns
rows = int(self.rows_var.get())
cols = int(self.cols_var.get())

# Calculate new image size to fit window
new_size = self.calculate_image_size()
if not new_size:
return
# Resize the image
resized_image = self.current_image.resize(new_size, Image.Resampling.LANCZOS)

# Calculate slice dimensions
slice_width = new_size[0] // rows
slice_height = new_size[1] // cols

# Configure grid weights for even distribution
for i in range(rows):
self.slices_frame.grid_rowconfigure(i, weight=1)
for j in range(cols):
self.slices_frame.grid_columnconfigure(j, weight=1)
# Generate and display slices
for i in range(rows):
for j in range(cols):
# Calculate slice coordinates
left = j * slice_width
upper = i * slice_height
right = left + slice_width
lower = upper + slice_height

# Create the slice
slice_image = resized_image.crop((left, upper, right, lower))
tk_image = ImageTk.PhotoImage(slice_image)

# Create and place the label
slice_label = tk.Label(self.slices_frame, image=tk_image,
bg="#f7f7f7", relief="solid", borderwidth=0)
slice_label.image = tk_image
slice_label.grid(row=i, column=j, padx=0, pady=0, sticky="nsew")


if __name__ == "__main__":
app = ImageSlicer()
app.mainloop()


OUTPUT:

Image Slicer Using Python Tkinter

Split Image Into Slices Using Python Tkinter

Create an Image Slicer Using Python Tkinter

Image Slicer App Using Python Tkinter

Image Spliter App Using Python Tkinter

Upload and Slice Image Using Python Tkinter


JavaScript Date - Add, Subtract and Finding the Difference

How to Create a Date Calculator Using JavaScript 


How to Create a Date Calculator Using JavaScript


In this Javascript tutorial, we will see how to create a dates calculator, where you can enter two dates, add or subtract a certain number of days from one of the dates, and calculate the difference in days between two dates.


Project Source Code:


<!DOCTYPE html>
<html>
<head>
<title>Date Difference Calculator</title>
<style>
body{ font-family: Arial, Helvetica, sans-serif; background-color: #555; }

form{ display: flex; flex-direction: column; max-width: 400px; margin: 0 auto;
padding: 20px; border-radius: 5px; background-color: #fff;
box-shadow: 0 2px 5px rgba(0, 0, 0, 0.2);
}
label{ margin-bottom: 5px; font-weight: bold; }

input[type="text"],
input[type="number"],
select{ padding: 10px; margin-bottom: 10px; border-radius: 5px;
border: 1px solid #ccc; background-color: #f2f2f2;
}

input[type="button"]{ padding: 10px 20px; border: none; border-radius: 5px;
background-color: #008cba; color: #fff; cursor: pointer;
margin-bottom: 5px; transition: all 0.3s ease;
}
input[type="button"]:hover{ background-color: #006f8b; }

#result{ max-width: 400px; margin: 20px auto; padding: 20px; border-radius: 5px;
background-color: #fff; box-shadow: 0 2px 5px rgba(0, 0, 0, 0.2);
}

</style>
</head>
<body>

<form id="date-form">
<label for="start-date">Start Date:</label>
<input type="text" id="start-date" placeholder="yyyy-mm-dd">
<br>
<label for="end-date">End Date:</label>
<input type="text" id="end-date" placeholder="yyyy-mm-dd">
<br>
<label for="days">Days:</label>
<input type="number" id="days" placeholder="Enter Number Of Days">
<br>
<input type="button" value="Add" id="add">
<input type="button" value="Substract" id="substract">
<input type="button" value="Calculate" id="calculate">
</form>
<div id="result"></div>

<script>

// Select the input elements we need to use
const startDateInput = document.getElementById("start-date");
const endDateInput = document.getElementById("end-date");
const daysInput = document.getElementById("days");
const resultLabel = document.getElementById("result");
const addButton = document.getElementById("add");
const substractButton = document.getElementById("substract");
const calculateButton = document.getElementById("calculate");
// Helper function to format the date in YYYY-MM-DD format
const formatDate = (date) => {
let d = new Date(date),
month = ''+(d.getMonth()+1),
day = ''+(d.getDate()+1),
year = ''+(d.getFullYear());
if(month.length < 2){
month = '0' + month;
}

if(day.length < 2){
day = '0' + day;
}

return [year, month, day].join('-');

}

// Add click event listeners to the buttons
addButton.addEventListener("click", () => {
// get the number of days from the input field and check if it's a valid number
let days = parseInt(daysInput.value);
if(!days){
resultLabel.innerHTML = "please enter a valid number of days";
return;
}
// get the start date from the input field, add the number of days, and update the input field
let startDate = new Date(startDateInput.value);
startDate.setDate(startDate.getDate() + days);
startDateInput.value = formatDate(startDate);
resultLabel.innerHTML = ""; // clear the error message

});


substractButton.addEventListener("click", () => {
// get the number of days from the input field and check if it's a valid number
let days = parseInt(daysInput.value);
if(!days){
resultLabel.innerHTML = "please enter a valid number of days";
return;
}
// get the start date from the input field, add the number of days, and update the input field
let startDate = new Date(startDateInput.value);
startDate.setDate(startDate.getDate() - days);
startDateInput.value = formatDate(startDate);
resultLabel.innerHTML = ""; // clear the error message

});


calculateButton.addEventListener("click", ()=>{

// get the start and end dates from the input fields
let start = new Date(startDateInput.value);
let end = new Date(endDateInput.value);

// check if the start date is before the end date, and display an error message if not
if(start > end){
resultLabel.innerHTML = "please enter a valid date range";
return;
}

// calculate the difference in days between the start and end dates
let difference = end-start;
let days = Math.round(difference / (1000*60*60*24));
resultLabel.innerHTML = `The difference between the two dates is ${days} days.`;

});


</script>


</body>
</html>


Code Explanation:

this JavaScript code, allows users to add or subtract days from a date, or calculate the difference in days between two dates.

This JavaScript code performs the following actions:

1 - The "Add" button, retrieves the number of days from the input field, checks its validity, and then updates the start date by adding the specified number of days. 
It also clears any prior error messages from the result area..

2 - The "Subtract" button, Similar to the "Add" button, but it subtracts the number of days from the start date.

3 - The "Calculate" button, retrieves start and end dates from input fields, checks for a valid date range, calculates the rounded difference in days between them, and then displays this difference in the result area.


OUTPUT:

JavaScript Date - Add, Subtract and Finding the Difference